Constant delays and budget overruns threatening the success of your projects? What if you could:
- Improve on-time delivery by 100% 1
- Identify potential delays up to 40% earlier 2
- Save costs
- Prevent unexpected issues
Enter Milestone Trend Analysis (MTA)—a premier tool that’s transforming how you manage projects. MTA not only enhances project delivery timelines but also strengthens risk management, leading to more successful outcomes.
In this blog, we’ll discover how MTA can fine-tune your approach to project management to record-breaking results and maintain control even in the most complex projects.
What is Milestone Trend Analysis?
Milestone Trend Analysis (MTA) is a crucial project management tool to monitor and evaluate the progress of a project over time by tracking key milestones. MTA involves plotting these milestones on a trend chart to visually assess whether a project is on schedule, ahead, or falling behind. This method allows project managers to quickly identify potential delays or issues and make informed decisions to keep the project on track.
Milestone Trend Analysis is essentially a time-phased representation of project milestones. By regularly updating milestone completion dates on a trend chart, project managers can identify trends and patterns in project performance.
For instance, in a large-scale construction project, MTA was critical in identifying delays in the delivery of key materials. By visualizing these delays early, the project manager could reallocate resources and adjust timelines to mitigate further impacts, ensuring the project remained on track.
Historical Context and Evolution of MTA
The concept of MTA has its roots in traditional project management practices, where milestone tracking was a manual process, often limited to simple charts or tables. As projects grew in complexity, particularly in industries like IT and construction, the need for more sophisticated tracking methods like MTA emerged.
Today, MTA has evolved significantly by integrating advanced digital tools and software. Platforms such as Microsoft Project and Primavera P6 now incorporate real-time data and predictive analytics to enhance the MTA process. These tools allow project managers to forecast future milestone trends by analyzing historical data and identifying patterns that may indicate potential risks.
For example, AI-powered software can predict milestone completion delays by analyzing past project performance and external factors like weather conditions in construction projects. This predictive capability enables project managers to proactively address issues before they escalate, optimizing resource allocation and ensuring timely project delivery.
Read More: Top 7 Project Management Trends You’ll Regret to Miss In 2024
Pros and Cons of Milestone Trend Analysis
Advantages of MTA
- Clear Visual Representation: MTA provides a clear visual representation of project progress over time, making it easier for project managers to track and communicate progress.
- Proactive Risk Management: By identifying trends early, MTA enables project managers to anticipate delays and intervene before they escalate, especially in complex projects.
- Stakeholder Confidence: MTA offers transparent updates that are easy for non-technical stakeholders to understand, maintaining their confidence in the project’s progress.
Disadvantages of MTA
- Potential Oversimplification: MTA focuses solely on milestones, which may overlook other critical aspects like resource allocation, team performance, and scope changes.
- Limited Effectiveness in Dynamic Projects: MTA’s emphasis on predefined milestones may not fully capture iterative development or Agile processes in projects with frequent changes.
- Data Dependency: MTA relies heavily on accurate and consistent data collection; any inconsistencies can lead to misleading trends and misguided decisions.
Balancing the Trade-offs
- Integrating with Other Tools: Combine MTA with other project management tools like Earned Value Management (EVM) or Agile metrics (e.g., burn-down charts) to gain a more comprehensive view of project performance.
- Dynamic Milestone Updates: Regularly review and update milestones to ensure they remain relevant as the project evolves, especially in environments with changing scope or timelines.
- Robust Communication Plan: Use MTA alongside a robust communication plan to engage stakeholders regularly, set realistic expectations, and maintain trust by explaining MTA’s role and limitations.
- Automation and Data Validation: Leverage automation and data validation tools to ensure the accuracy and consistency of data used in MTA, reducing the risk of errors that could compromise the analysis.
Misconception about Milestone Trend Analysis
| Misconception | Reality |
| MTA is Only for Large Projects | MTA can be applied to projects of any size to track progress and identify potential delays early. |
| MTA is Too Complicated | While it requires some initial setup, MTA is straightforward once integrated into the project management process. |
| MTA Guarantees Project Success | MTA is a tool for managing and tracking progress, but it does not replace the need for effective project management practices. |
| MTA is Only for Tracking Delays | MTA also helps in recognizing early completions and understanding overall project trends. |
| MTA is Redundant with Other Tools | MTA complements other tools by providing a clear visual representation of milestone trends over time. |
Industry-Specific Applications of Milestone Trend Analysis
Milestone Trend Analysis in IT Projects

IT projects, especially in software development, often involve multiple iterations and stages, such as requirements gathering, design, coding, testing, and deployment. MTA allows project managers to track these critical milestones over time, providing a clear view of progress against the planned schedule.
For example, suppose the testing phase consistently trends behind schedule in the MTA chart. In that case, this early warning signal enables the project team to allocate additional resources or adjust timelines proactively, thereby avoiding cascading delays that could impact the final delivery.
In IT, where Agile and DevOps methodologies dominate, MTA integrates seamlessly with sprint planning and continuous integration/continuous deployment (CI/CD) pipelines.
By visualizing milestone trends, project managers can better coordinate cross-functional teams and manage the complexities of iterative development. This ensures that key deadlines are met and the project remains aligned with overall business goals.
Milestone Trend Analysis in Construction and Manufacturing Projects

MTA is indispensable for maintaining control over project timelines in the construction and manufacturing industries, where projects are often large-scale, capital-intensive, and subject to strict regulatory standards.
Construction projects typically have numerous interdependent milestones, such as design approvals, permits, material deliveries, and phase completions (e.g., foundation, framing, electrical). By applying MTA, project managers can monitor the progression of these milestones in real-time, identifying any delays that could potentially disrupt the project’s critical path.
For instance, if the MTA chart reveals a trend of delays in the material delivery milestone, the project manager can immediately investigate and implement corrective actions, such as expediting orders or sourcing alternative suppliers. This proactive approach helps to prevent delays from snowballing into larger issues that could impact project costs and delivery schedules.
In manufacturing, MTA is equally valuable in managing product development cycles, from initial design through to final production. By tracking key milestones, such as prototype completion, testing, and production ramp-up, MTA clearly shows whether the project is progressing as planned or if you need adjustments to stay on schedule.
In both industries, MTA enhances transparency and accountability, enabling project managers to communicate more effectively with stakeholders, manage risks, and ensure on-time and on-budget project completion. This level of detailed oversight is critical for maintaining project momentum and achieving successful outcomes in highly regulated and complex project environments.
How MTA Differs from Other Project Tracking Tools
MTA vs. Gantt Charts

Gantt Charts:
- Highly effective for visualizing project timelines and task dependencies.
- Provides a detailed view of tasks, durations, and their overlaps.
- It can become cluttered and difficult to interpret in complex projects with many interdependent tasks.
- The volume of information in large-scale projects can obscure critical insights, making it hard to assess overall project health quickly.
MTA Advantage:
- Offers a cleaner, high-level perspective by focusing exclusively on milestone progress over time.
- Concentrates on critical milestones that signify significant project achievements or decision points.
- Allows project managers to assess whether the project is on track, ahead, or behind schedule without overwhelming them with granular task details.
- Particularly beneficial for long-term projects with critical milestones, such as in construction, aerospace, or software development.
- Simplicity makes MTA more effective for communicating progress to stakeholders, especially those who do not need detailed task-level information.
- Facilitates strategic decision-making by focusing on the big picture and aligning project managers and stakeholders on goals and timelines.
MTA vs. Critical Path Method (CPM)

Critical Path Method (CPM):
- Identifies the longest sequence of tasks that determines the overall project duration.
- Helps in scheduling and resource allocation by pinpointing critical tasks that must be completed on time.
- Focuses on task dependencies and timelines but does not dynamically track milestone trends.
MTA Advantage:
- Complements CPM by adding dynamic monitoring of critical milestones.
- Tracks whether milestones are met as planned, offering trend analysis that shows if the project is on track, ahead, or behind schedule.
- Helps anticipate potential delays in critical milestones, allowing for proactive adjustments to the project plan.
Integrated Approach:
- Combining CPM and MTA provides a comprehensive view of project performance.
- CPM ensures efficient resource allocation for critical tasks, while MTA offers ongoing visibility into milestone achievements.
- This approach aligns with modern project management best practices, emphasizing proactive risk management and strategic decision-making.
Read More: Critical Path Project Management: Save Time by 20% Guide ✅
MTA vs. Earned Value Management (EVM)
Earned Value Management (EVM):
- Integrates scope, schedule, and cost metrics to measure project performance and progress.
- Offers detailed insights into cost and schedule variances, providing a quantitative analysis for informed decision-making.
- Due to its reliance on intricate calculations and data analysis, it can be complex and challenging for non-technical stakeholders to interpret.
MTA Advantage:
- Simplifies project tracking by focusing solely on milestone achievement.
- Provides an easy-to-understand visual representation of progress, making it more accessible for stakeholder communication.
- Unlike EVM, MTA offers a straightforward, trend-based analysis that highlights whether key milestones are being met according to plan.
- Particularly effective for projects where timely milestone delivery is the primary measure of success, ensuring clear communication with all stakeholders.
Complementary Use:
- MTA complements other project management tools like Gantt Charts, CPM, and EVM.
- Adds a layer of trend analysis focused on milestone progress, offering a simpler yet effective way to monitor and communicate project progress.
- This is highly beneficial for projects in industries like construction, aerospace, or IT, where meeting key dates is critical.
Core Components of Milestone Trend Analysis
Milestones
Milestones are key project markers that signify the completion of critical tasks or phases, providing a high-level overview of the project’s progress. For MTA to be effective, you must select the milestones and strategically place them to reflect the most critical aspects of the project timeline.
Align Milestones with Project Objectives: Start by ensuring each milestone aligns directly with the project goals. Milestones should represent critical decision points, approvals, or deliverables essential to project success.
For instance, key milestones in a software development project might include completing the requirements specification, finishing the coding phase, and passing user acceptance testing.
Make Milestones Measurable and Specific: Vague milestones can lead to confusion and make it difficult to assess progress accurately. Define milestones with clear, measurable outcomes. For example, instead of setting a milestone for “design completion,” specify “design approval by the client,” which provides a clear, objective criterion for completion.
Balance the Number of Milestones: Too few milestones can lead to a lack of control and oversight, while too many can overwhelm the project team and dilute focus. Best practices suggest setting milestones after major project phases or when key deliverables are handed off to stakeholders. This ensures that milestones are both meaningful and manageable.
Integrate Milestones with the Project Schedule: You should integrate Milestones into the overall project schedule, ideally using project management tools that allow dynamic updating and tracking. Tools like Microsoft Project can link milestones with tasks, dependencies, and deadlines, ensuring the entire project team is aligned and aware of upcoming critical dates.
Review and Adjust Milestones Regularly: As projects evolve, so too might the relevance or timing of certain milestones. Review milestones regularly during project status meetings to ensure they align with the project’s current trajectory. This flexibility allows project managers to adapt to changes while controlling the project’s critical path.
Types of Milestones (Internal vs. External)
Understanding the distinction between internal and external milestones allows you to better align project tracking with stakeholder expectations and project deliverables.
Internal Milestones: These key points within the project are primarily used for internal tracking and management purposes. Internal milestones typically represent progress points that are important for the project team but may not necessarily be visible or relevant to external stakeholders.
Examples of internal milestones include the completion of specific project phases, like the design phase in an IT project or the installation of equipment in a manufacturing setting. Internal milestones help maintain team focus, ensure that the project is progressing as planned, and allow for early detection of potential delays.
External Milestones: In contrast, external milestones are of significant interest to external stakeholders, such as clients, regulatory bodies, or upper management. These milestones often represent critical points of project delivery, such as the handover of a completed prototype, the final product delivery, or regulatory approval.
External milestones are crucial for managing stakeholder expectations and are often tied to contract terms, payment schedules, or official project evaluations. Meeting external milestones on time is often critical for maintaining stakeholder trust and ensuring the smooth continuation of the project.
Integration of Internal and External Milestones: Best practices in project management emphasize the need to carefully integrate both internal and external milestones into the project schedule. This integration ensures that internal progress aligns with external expectations, creating a cohesive project management strategy supporting operational efficiency and stakeholder satisfaction.
Tools like Primavera P6 3 and Microsoft Project 4 can manage and track these milestones, ensuring they are updated and communicated effectively across all relevant parties.
Balance Internal and External Milestones: Project managers must strike the right balance between internal and external milestones. Overemphasis on internal milestones can lead to a disconnect with external stakeholder expectations, while focusing too heavily on external milestones may overlook crucial internal checkpoints.
Regular review and adjustment of these milestones, especially during project status meetings, help maintain this balance and ensure that the project stays on track internally and externally.
Proprietary Techniques for Milestone Setting
Proprietary techniques for milestone setting involve tailoring milestone identification and tracking to the specific needs of the organization or project. These techniques often leverage unique methodologies or frameworks that a company has developed over time.
For example, in agile environments, some organizations have devised proprietary milestone-setting techniques that align closely with sprint goals, ensuring that milestones reflect both the completion of significant tasks and the achievement of strategic objectives.
These techniques might also incorporate specialized tools or software that provide enhanced milestone tracking and reporting capabilities, ensuring that the milestones set are relevant, measurable, and actionable.
Using Data-Driven Methods for Milestone Precision

Incorporating data-driven methods into milestone setting is becoming increasingly important in modern project management. By analyzing historical project data, you can set more accurate and realistic milestones, reducing the likelihood of delays.
Data-driven methods use project analytics tools that assess past performance metrics, such as average task completion times, resource allocation efficiency, and common bottlenecks. This approach allows for fine-tuning milestones, ensuring they are both challenging and achievable.
In industries like software development and construction, where delays can have significant cost implications, data-driven milestone setting is a best practice that enhances project precision and reliability.
Custom Milestone Categories for Complex Projects
Complex projects, such as those in the aerospace or large-scale infrastructure sectors, often require a more nuanced approach to milestone setting. Custom milestone categories allow project managers to categorize milestones based on specific project needs, such as regulatory compliance, phased handovers, or multi-stakeholder approvals.
For example, in a large infrastructure project, milestones might be categorized into design approval, regulatory inspection, and phase completion milestones, each with its own criteria and tracking mechanisms. This customized approach ensures that all critical aspects of the project are monitored closely, allowing for timely interventions and adjustments as needed.
By tailoring milestone categories to the unique demands of a project, managers can better align their tracking with overall project goals and complexities.
Trend Analysis: Reading the Data
How to Track and Visualize Milestone Trends
To accurately monitor milestone progress, project managers must employ both systematic data collection methods and advanced visualization tools that present the data clearly and actionably.
Systematic Data Collection: The first step in tracking milestone trends is to establish a consistent and reliable data collection method. This involves setting up regular reporting intervals where the actual completion dates of milestones are recorded and compared against planned dates.
Project management software tools like Microsoft Project automate this process5, ensuring that data is captured accurately and in real time. Automation reduces human error and provides project managers with up-to-date information, which is crucial for identifying emerging trends early.
Visualizing Milestone Trends: Once data is collected, it must be visualized to highlight the project’s trajectory. Trend charts are the most common visualization tool used in MTA, where the x-axis represents reporting periods (e.g., weeks and months), and the y-axis represents milestone dates.
As milestones are updated, the trend lines on these charts show whether the project is progressing as expected, ahead of schedule, or falling behind. A steady line indicates consistent progress, while upward or downward trends can signal potential issues.
Visualization tools like Power BI or Tableau can further enhance these charts by allowing for interactive features, such as drilling down into specific milestones or comparing different phases of the project.
Interpreting the Trends: The real value of trend analysis lies in the ability to interpret the data and take action. For example, if a trend chart shows that critical milestones are consistently being delayed, it may indicate underlying issues such as resource constraints, scope changes, or inefficiencies in the project workflow.
By recognizing these patterns early, project managers can investigate the root causes and implement corrective measures before the delays impact the overall project timeline. Conversely, if trends show milestones being completed ahead of schedule, it may offer opportunities to accelerate subsequent phases or reallocate resources to other areas.
Regular Review and Adjustment: Finally, for trend analysis to be effective, it must be part of a regular review process. Project managers should integrate trend analysis into their routine project status meetings, using the visualized data to facilitate discussions and make informed decisions. Adjusting the project plan based on these trends ensures that the project remains aligned with its goals and can adapt to any unforeseen changes.
Key Metrics to Watch (e.g., Schedule Slippage, Milestone Stability)
Key metrics are crucial for the early detection of potential issues, enabling project managers to take corrective actions before they escalate into major problems.
Schedule Slippage: One of the most critical metrics to monitor is schedule slippage, which occurs when milestones are consistently delayed beyond their planned dates. This metric directly indicates whether your project is falling behind schedule.
By tracking the slippage of each milestone over time, you can identify patterns or recurring issues that might be causing delays, such as resource constraints, unforeseen risks, or scope changes.
Regularly reviewing schedule slippage allows you to make timely adjustments to the project plan, such as reallocating resources, revising timelines, or renegotiating deadlines with stakeholders.
Milestone Stability: Milestone stability refers to the consistency with which milestones are met according to the original schedule. High stability indicates that the project is progressing as planned, with little to no deviation from the timeline.
On the other hand, low stability suggests frequent changes or delays, which could signal deeper issues in project planning or execution. Monitoring milestone stability helps project managers control the project and quickly address any deviations.
This metric is particularly valuable in complex projects with multiple interdependent milestones, where maintaining alignment across all phases is critical to overall success.
Trend Consistency: Another critical metric to watch is trend consistency, which tracks the overall direction of your milestone trends. Are your milestones consistently trending towards earlier completion on-time delivery, or are they slipping further behind?
Trend consistency helps project managers understand whether the project is gaining momentum, remaining stable, or facing increasing challenges. Identifying the root causes of any inconsistencies early on allows for more targeted interventions, such as refining processes, improving communication, or addressing specific bottlenecks.
Impact of External Factors: External factors such as market conditions, regulatory changes, or supply chain disruptions can significantly impact milestone achievement. Tracking the influence of these external variables on your key metrics is essential for comprehensive trend analysis.
For instance, a spike in schedule slippage could be linked to external supply chain delays, prompting the need for contingency planning. By incorporating external factors into your analysis, you can better anticipate and mitigate risks outside the project team’s immediate control.
How to Implement Milestone Trend Analysis in Your Project
Step 1: Project Planning and Milestone Identification
Define Project Objectives and Scope: Before identifying milestones, it’s essential to clearly understand the project’s objectives and scope. This clarity allows you to pinpoint the critical phases and deliverables that will serve as milestones. Best practices suggest involving key stakeholders early to ensure the milestones align with overall business goals and stakeholder expectations.
Select Meaningful and Measurable Milestones: Milestones should be significant, representing key decision points, approvals, or deliverables within the project. They must be both meaningful—impacting the project’s success—and measurable, with clear criteria for completion.
For instance, instead of vague milestones like “Design Phase Completed,” specify milestones such as “Final Design Document Approved by Stakeholders,” which provides a concrete indicator of progress.
Ensure Milestone Realism and Feasibility: Each milestone must be realistic and achievable within the project’s constraints. Utilize historical data and benchmarking to set ambitious yet feasible milestones. This step is essential in complex projects, where overly aggressive milestones can lead to schedule slippage and resource strain.
Integrate Milestones into the Project Schedule: Once identified, milestones should be integrated into the overall project schedule using advanced project management tools like Microsoft Project, Primavera P6, or Mirorim.
These tools allow you to map out dependencies, allocate resources, and set timelines that align with the project’s critical path. Ensure milestones are evenly distributed across the project timeline to provide regular checkpoints for tracking progress.
Establish Reporting Mechanisms: To support MTA, set up a robust reporting mechanism that includes regular updates on milestone status. Automated reporting tools can ensure that milestone data is collected consistently and accurately, providing the real-time insights needed for effective trend analysis.
Step 2: Data Collection and Monitoring
Without precise and timely data, the insights provided by MTA are at risk of being misleading, making it imperative for project managers to establish robust data collection and monitoring processes from the outset.
Establish Clear Data Collection Protocols: Define the specific data points you must collect for each milestone. This includes the planned and actual completion dates and contextual information, such as the reasons for any delays or early completions.
Implement standardized data entry protocols to ensure consistency across the project team. Use software tools like Microsoft Project to automate data capture and provide real-time updates as milestones are met.
Automate Data Collection Where Possible: Automation reduces human error and ensures data accuracy. Leverage tools that integrate directly with your project management platform to automatically track milestone progress.
For example, tools like Power BI or Tableau can pull data from your project management software and update dashboards in real-time, allowing continuous monitoring without manual intervention.
Regular Monitoring and Reporting: Data should be monitored regularly, with reports generated at predefined intervals—whether weekly, bi-weekly, or monthly—depending on the project’s complexity and timeline.
Set up automated alerts within your project management tools to notify you of any deviations from the planned milestone dates. These alerts serve as early warning signals, allowing you to address issues before they escalate.
Ensure Data Integrity: The integrity of your data is paramount. Regularly audit your data collection processes to ensure all information is accurate and up-to-date. In complex projects, consider appointing a data steward responsible for overseeing the data collection process, verifying its accuracy, and ensuring it is consistently entered into the system.
Leverage Real-Time Dashboards: Use real-time dashboards to visualize milestone progress and trends. These dashboards should be accessible to all relevant stakeholders, guaranteeing to inform everyone of the project’s status at all times.
Dashboards help project managers and stakeholders quickly identify trends, potential risks, and areas that require immediate attention by providing a clear, visual representation of data.
Step 3: Analyzing Trends and Identifying Risks Early
The true value of Milestone Trend Analysis lies in its ability to reveal emerging trends and highlight potential risks before they become critical issues. For project managers aiming to maintain control over complex projects, this step is crucial in ensuring that the project stays on course and within scope.
Interpreting Trend Data: Begin by closely examining the emerging trends from your milestone data. Look for patterns that indicate deviations from the original project plan, such as repeated delays in specific milestones or consistent slippage across multiple milestones.
These patterns are often early warning signs of underlying issues, such as resource bottlenecks, scope creep, or inadequate planning. Visual tools like trend charts and dashboards make these patterns more apparent, allowing for quicker identification of potential risks.
Root Cause Analysis: Once you identify a trend, perform a root cause analysis to determine the underlying factors contributing to these deviations. This involves investigating all potential causes, from resource allocation issues to external factors like supply chain disruptions or stakeholder changes.
Engaging with your project team and stakeholders to gather insights can provide a more comprehensive understanding of the risks involved. Advanced project management tools with integrated analytics can assist in this process by correlating different data points, helping you pinpoint the exact causes of the trend.
Proactive Risk Mitigation: With the root causes identified, it’s time to develop and implement risk mitigation strategies. This might involve reallocating resources, adjusting timelines, or even re-scoping certain elements to ensure the project remains on track.
Proactive risk management is a hallmark of successful project management and is essential for maintaining project momentum and avoiding costly delays. Ensure these mitigation strategies are communicated clearly to all stakeholders and integrated into the project plan.
Continuous Monitoring and Adjustment: Risk identification and mitigation is not a one-time task; it requires continuous monitoring. Regularly update your trend analysis with new data and reassess risks as the project progresses.
This ongoing process allows you to avoid potential issues, making adjustments as needed to keep the project aligned with its objectives. Automation tools that offer real-time data updates and alerts are particularly valuable in this phase, ensuring that no critical changes go unnoticed.
Documentation and Communication: Finally, document all identified risks, their root causes, and the mitigation strategies you have implemented. This documentation is a reference for ongoing risk management and helps ensure that all team members and stakeholders know the current project status and any potential challenges.
Effective communication of these risks and their mitigations is crucial for maintaining stakeholder confidence and ensuring project transparency.
Can You Implement MTA In Agile Projects?
Yes, Milestone Trend Analysis can be effectively implemented in Agile projects, although it requires some adaptation to align with Agile’s iterative and flexible nature. In traditional project management, MTA is used to track the progress of key milestones over time, offering a clear view of whether a project is on schedule.
In Agile environments, while the focus is more on delivering incremental value through sprints, the concept of milestones can still be highly relevant.
Adapting MTA to Agile
In Agile projects, milestones might be defined around key deliverables, such as completing a specific feature set, a major release, or an iteration that delivers a minimum viable product (MVP).
Instead of tracking a linear project plan, MTA in Agile can be adapted to monitor the progress of these key deliverables across multiple sprints. By visualizing trends in milestone achievement, Agile teams can identify potential delays early and adjust their sprint planning accordingly.
Benefits of MTA in Agile
MTA brings a layer of predictability to Agile projects by allowing teams to monitor the cumulative progress of their work. This is particularly useful in large-scale Agile projects or a Scaled Agile Framework (SAFe) 6 environment, where multiple teams work concurrently towards common goals. MTA helps maintain alignment across teams and ensures that critical milestones are met, even as the project evolves.
Challenges and Considerations
One challenge of implementing MTA in Agile is ensuring that milestones are flexible enough to accommodate the iterative nature of Agile work. Milestones should be dynamic and able to adjust as the scope evolves with each sprint.
Additionally, the emphasis on continuous delivery in Agile means that MTA should complement other Agile metrics, such as burn-down charts and velocity, rather than as a standalone tracking tool.
Case-Based Examples of Milestone Trend Analysis
Gotthard Base Tunnel, Switzerland

The Gotthard Base Tunnel 78, spanning 57 kilometers through the Swiss Alps, is the world’s longest and deepest railway tunnel. The project aimed to create a direct route for high-speed trains and heavy freight, reducing journey times and increasing transport efficiency across Europe.
Challenges: The project faced unprecedented challenges, including extreme geological conditions, tight deadlines, and the need to coordinate thousands of workers across multiple sites. Any delays in critical activities like tunnel boring or track laying could have severe cascading effects on the entire project.
Implementation of MTA: MTA was employed to track the progress of key construction milestones such as the completion of tunnel boring, installation of rail systems, and final safety checks. Project managers used MTA to visualize trends in milestone completion, allowing them to spot delays early and take corrective action, such as reallocating resources or adjusting schedules.
Quantitative Results: MTA enabled project managers to reduce potential schedule slippage by approximately 15%, ensuring the project remained on schedule and within the CHF 9.56 billion budget. The ability to monitor progress in real-time and adjust plans dynamically was crucial in successfully delivering this complex project on time.
Crossrail Project, London
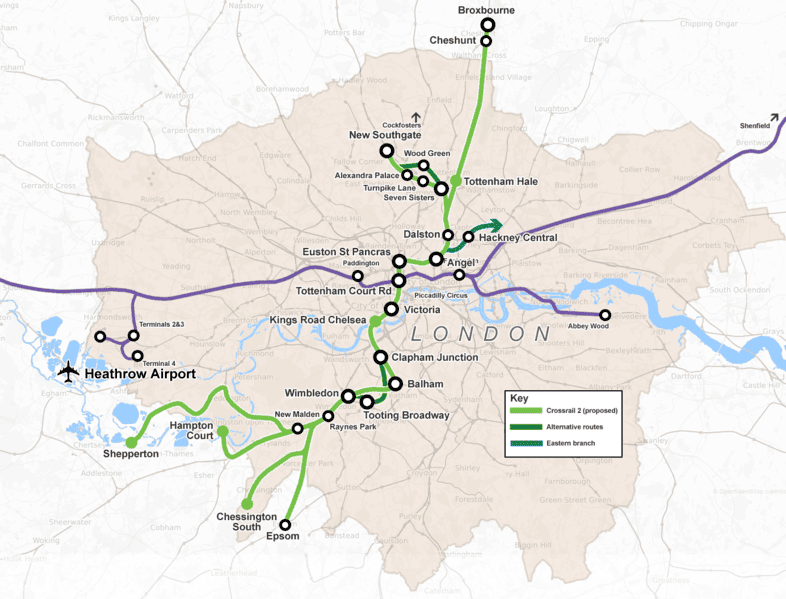
The Crossrail project 9, also known as the Elizabeth Line, is one of Europe’s largest infrastructure projects, designed to connect East and West London through a high-capacity railway. It involved constructing 42 kilometers of new tunnels and integrating them with existing railway infrastructure.
Challenges: The project encountered significant challenges, including delays in station construction, integration of new signaling systems, and coordination across multiple contractors and stakeholders. These issues had the potential to derail the project’s tight timeline.
Implementation of MTA: MTA was used extensively to monitor critical milestones, such as tunnel completion, station construction, and integration of the new signaling software.
By tracking these milestones closely, project managers could visualize delays up to 20% earlier than with traditional tracking methods. This allowed them to implement mitigation strategies to minimize disruptions, such as rescheduling workstreams and reallocating resources.
Quantitative Results: Despite the challenges, MTA helped the project team manage delays effectively, bringing several critical components back on schedule. The early identification of risks and proactive adjustments enabled the project to progress toward its revised timelines, ultimately contributing to the successful opening of the Elizabeth Line.
Heathrow Terminal 5, London

Heathrow Terminal 5 10 was a £4.3 billion project to construct a new terminal at one of the world’s busiest airports. The project was divided into over 147 sub-projects and involved more than 1,000 work packages, making it one of the most complex construction projects in Europe at the time.
Challenges: The project faced significant risks, including complex logistics, tight timelines, and the need for extensive collaboration among multiple contractors and stakeholders. Any delay in key milestones could have had major financial and operational impacts.
Implementation of MTA: MTA was implemented to track milestones across all construction phases, from structural completion to operational readiness. The project management team used MTA to continuously monitor progress, identify risks early, and adjust schedules as necessary. This approach allowed for real-time decision-making and dynamic resource allocation.
Quantitative Results: The use of MTA contributed to the successful delivery of the terminal on time and within budget. The ability to manage risks proactively and adjust plans in response to emerging trends was critical in achieving the project’s objectives, and the success of Terminal 5 has since become a model for managing mega-projects.
Advanced MTA Techniques
Predictive Analytics in MTA
Use Historical Data to Predict Future Trends: In the evolving landscape of project management, predictive analytics has become a powerful tool within Milestone Trend Analysis (MTA). By leveraging historical project data, predictive analytics allows project managers to forecast future trends in milestone completion with greater accuracy.
This involves analyzing patterns in past projects—such as typical delays in similar tasks or the impact of resource allocation changes—and applying these insights to current projects. This proactive approach enables project managers to anticipate potential delays before they occur, allowing for timely interventions that keep the project on track.
AI and Machine Learning: Integrating Artificial Intelligence (AI) and Machine Learning (ML) into MTA has opened new avenues for advanced trend analysis. AI-driven tools can process vast amounts of data from multiple projects, learning from past performance to predict outcomes with increasing precision.
Machine learning algorithms can identify complex patterns and correlations that may not be immediately apparent, providing project managers with deeper insights into potential risks and opportunities. For instance, AI can predict the likelihood of a milestone being delayed based on factors like team performance, external dependencies, or even market conditions.
Proprietary Predictive Models: Some organizations are developing proprietary predictive models tailored to their specific project environments. These models are built using historical data from previous projects, allowing for customized forecasting that accounts for unique industry challenges and organizational practices.
For example, a construction firm might create a model that predicts material delivery delays based on historical supplier performance and external factors like weather conditions.
Custom Predictive Models Based on Past Projects: Custom predictive models are valuable in organizations that manage large-scale, repetitive projects, such as infrastructure development or software engineering.
By analyzing past projects, organizations can create models that forecast milestones more accurately, considering variables like project scope, resource availability, and stakeholder engagement. These models can then be refined and adjusted as more data is collected, improving their accuracy over time and providing a competitive edge in project delivery.
Real-time MTA: Moving Beyond Static Analysis
Tools for Real-Time Data Collection and Analysis: Moving beyond static milestone tracking, real-time MTA leverages modern tools and technologies to continuously update project progress. Tools like Power BI, Tableau, and advanced project management platforms like Microsoft Project offer real-time dashboards that visualize milestone trends as they develop 11.
These tools collect data from various sources, including team updates, sensor data in construction projects, or market feeds in financial projects, ensuring that project managers have the most current information at their fingertips.
Benefits and Drawbacks of Real-Time MTA: The primary benefit of real-time MTA is its ability to provide immediate insights, allowing project managers to react swiftly to any deviations from the plan. This is especially critical in dynamic project environments where conditions can change rapidly.
However, the drawback is that real-time MTA requires a robust infrastructure for data collection and processing, which can be resource-intensive. Additionally, the constant influx of data can sometimes lead to information overload, making it challenging to focus on the most critical trends without the right filters and prioritization mechanisms.
Industry-Specific Real-Time MTA Applications
High-Frequency Trading: In high-frequency trading, where decisions must be made in milliseconds, real-time MTA monitors the progress of trading algorithms and strategies. Any deviation from expected performance trends can be detected immediately, allowing traders to adjust algorithms on the fly to optimize outcomes.
Large-Scale Infrastructure Projects: In large-scale infrastructure projects, such as the construction of bridges or tunnels, real-time MTA allows for the continuous monitoring of milestone achievements. For instance, sensors embedded in construction materials can provide live updates on the progress of concrete curing or structural integrity, which can then be fed into MTA tools to ensure that project timelines are met without compromising safety or quality.
Read More: Burn Rate Chart ✅ Guide for +30% Project Completion
Conclusion
- Core Components of MTA: Understanding how to define and set milestones correctly is crucial for accurate Milestone Trend Analysis, ensuring that your project stays on track.
- Predictive Analytics and Real-Time Monitoring: Advanced techniques like predictive analytics, leveraging AI, and real-time data monitoring can significantly enhance the effectiveness of MTA, allowing project managers to anticipate and mitigate risks proactively.
- Application in Various Industries: MTA can be adapted in different project environments, including agile projects and large-scale infrastructure initiatives, providing flexibility and robust insights across diverse sectors.
- Balancing MTA with Other Tools: Integrating MTA with other project management tools like Earned Value Management (EVM) and Agile metrics ensures a comprehensive approach to monitoring and guiding project success.
To elevate your project management practices, Create a Free Account on Mirorim today. Mirorim offers the most effective project management software, designed to seamlessly integrate MTA into your workflow with real-time insights and predictive analytics.
FAQ | Milestone Trend Analysis
Milestone Trend Analysis (MTA) is essential because it provides a clear, visual representation of a project’s progress over time.
By tracking key milestones, MTA helps project managers identify potential delays early, enabling proactive risk management and ensuring that projects stay on schedule. This method enhances decision-making and improves communication with stakeholders.
The number of milestones in a project depends on its complexity and duration. Generally, it’s advisable to set milestones at key deliverables or decision points.
For small projects, 5-10 milestones may suffice, while larger, more complex projects might require 15-20 or more. The goal is to provide sufficient checkpoints without overwhelming the project team with unnecessary detail.
MTA works by plotting the planned and actual completion dates of milestones on a timeline. As the project progresses, the trend chart shows whether milestones are being met as planned, ahead of schedule, or delayed. This visual tool allows project managers to quickly assess the project’s health and take corrective action if needed.
If your project involves multiple phases, critical deadlines, or close monitoring, MTA is highly beneficial —especially where keeping track of progress and anticipating risks is crucial. If your project is straightforward and short-term, traditional tracking methods might be sufficient.
In Microsoft Project, Milestone Trend Analysis can be conducted by setting up milestones within the project plan and tracking their progress over time. MS Project allows you to create visual reports that show milestone trends, making it easier to monitor project progress and identify potential delays.
In the SAP Project System (SAP PS), Milestone Trend Analysis monitors project milestones by capturing the planned and actual dates. SAP PS provides detailed reporting capabilities that help project managers track progress, analyze trends, and ensure milestones are timely.
The primary purpose of an MTA is to monitor and visualize the progress of project milestones over time. It helps project managers identify trends, such as delays or advancements, allowing for timely interventions. MTA also improves stakeholder communication by providing clear, visual updates on project status.
An MTA chart is a graphical representation used in Milestone Trend Analysis to track the progress of milestones over time. The chart plots each milestone’s planned and actual completion dates, providing a visual trend line indicating whether the project is on schedule, ahead, or behind.
A milestone diagram visually represents the key milestones within a project. It typically shows the sequence of milestones along a timeline, highlighting critical points that must be achieved for the project to stay on track. This diagram helps project teams and stakeholders quickly understand the project’s progress and upcoming deadlines.
In the context of Key Performance Indicators (KPIs), milestones are specific goals or achievements that indicate progress toward the overall objectives of a project or business strategy. Milestones in KPI tracking help measure whether the project is on course to meet its goals, serving as benchmarks for success.
Milestone workflow refers to the process and sequence in which project milestones are planned, executed, and monitored. It involves defining each milestone, assigning responsibilities, tracking progress, and ensuring that each milestone is completed in the correct order and on time.
An example of MTA could be its use in a construction project where key milestones such as design approval, foundation completion, and final inspection are tracked over time. By monitoring these milestones, project managers can visualize any delays and take corrective actions to keep the project on track.
To measure a milestone, define clear, measurable criteria for its completion. This could include specific deliverables, approvals, or achievements that indicate the milestone is complete. Tracking the actual completion date against the planned date will help assess whether the milestone was met on time.
To create a milestone, identify key deliverables or decision points in your project that are critical to its success. Milestones should be clearly defined, with specific criteria for completion. Once identified, add these milestones to your project timeline and assign responsibility for their achievement.
A milestone checklist is a tool for tracking the progress of milestones within a project. It lists all the key milestones, along with their planned completion dates, responsible parties, and any specific criteria required for completion. This checklist helps ensure that all milestones are monitored and met on time.
To draw a milestone chart, list all the key milestones in your project. Then, plot these milestones along a timeline, showing both the planned and actual completion dates. Use lines or markers to connect milestones and indicate their progress over time. Software tools like Microsoft Project, Excel, or specialized project management platforms can help automate this process.
The four types of milestones typically include:
Project Milestones: Major deliverables or phases in the project lifecycle.
Financial Milestones: Key financial achievements, such as securing funding or reaching revenue targets.
Decision Points: Critical approvals or decisions that move the project forward.
External Milestones: Milestones are dependent on external factors, such as regulatory approvals or third-party deliverables.
MTA is best used in projects where tracking progress over time is critical, especially in complex or long-term projects with multiple phases. It’s particularly effective when early detection of delays is crucial, when there’s a need for clear communication with stakeholders, or when proactive risk management is a priority.
References
- Time Critical Delivery and a Custom Supply Chain Solution. (2021). In Lynnco. Lynnco. Retrieved August 17, 2024, from https://marketing.lynnco.com/hubfs/LynnCo%20Case%20Study%20-%20Time%20Critical%20Delivery_Glass%20Mfg.pdf ↩︎
- Kruachottikul, P., Dumrongvute, P., Tea-Makorn, P., Kittikowit, S., & Amrapala, A. (2023). New product development process and case studies for deep-tech academic research to commercialization. Journal of Innovation and Entrepreneurship, 12(1). https://doi.org/10.1186/s13731-023-00311-1 ↩︎
- Lepage, M. (2024, January 12). Here’s A Quick Way To Keep Your Primavera P6 Milestones in Focus. Plan Academy. https://www.planacademy.com/keep-your-milestones-in-focus-in-primavera-p6/ ↩︎
- Six, T. (2019, February 14). Microsoft Project and Schedule Milestones. Ten Six Consulting. https://tensix.com/microsoft-project-and-schedule-milestones/ ↩︎
- Pandey, S., & Pandey, S. (2024, July 23). Using Microsoft Power Automate for Project Management Automation. BrightWork.com. https://www.brightwork.com/blog/power-automate-projects ↩︎
- What is SAFe – Framework For Business Agility | Scaled Agile. (2024, August 15). Scaled Agile. https://scaledagile.com/what-is-safe/ ↩︎
- The Gotthard Base Tunnel – news.admin.ch. Available at: https://www.news.admin.ch/NSBSubscriber/message/attachments/39644.pdf ↩︎
- Stephens, T. (2024, January 28). Why is the Gotthard Base Tunnel so important? SWI swissinfo.ch. https://www.swissinfo.ch/eng/politics/why-is-the-gotthard-base-tunnel-so-important/48756122 ↩︎
- Kershaw, S., Lord, A., Kelly, D. B., Wild, M., Crawford, J., Carr, R., Scopes, R., McLean, R., Fornes, V., Halstead, R., Brown, C., Bain, R., Zavitz, R., Smith, H., & Stuckey, M. (n.d.). Crossrail Project 2019 to 2023: Completing the Elizabeth Line. https://www.apm.org.uk/v2/media/10vnyi1q/crossrail-project-2019-to-2023-completing-the-elizabeth-line-apm-journal.pdf ↩︎
- Jones, R. (2021, July 27). HS2 and Heathrow Terminal 5: A case study on Project Management influence. Structures Insider. https://www.structuresinsider.com/post/hs2-and-heathrow-t5-a-case-study-on-project-management-influence ↩︎
- Bar, M. (2024, June 3). Visualize and Explore Data with Real-Time Dashboards. Microsoft Fabric Blog | Microsoft Fabric. https://blog.fabric.microsoft.com/en-us/blog/visualize-and-explore-data-with-real-time-dashboards/ ↩︎