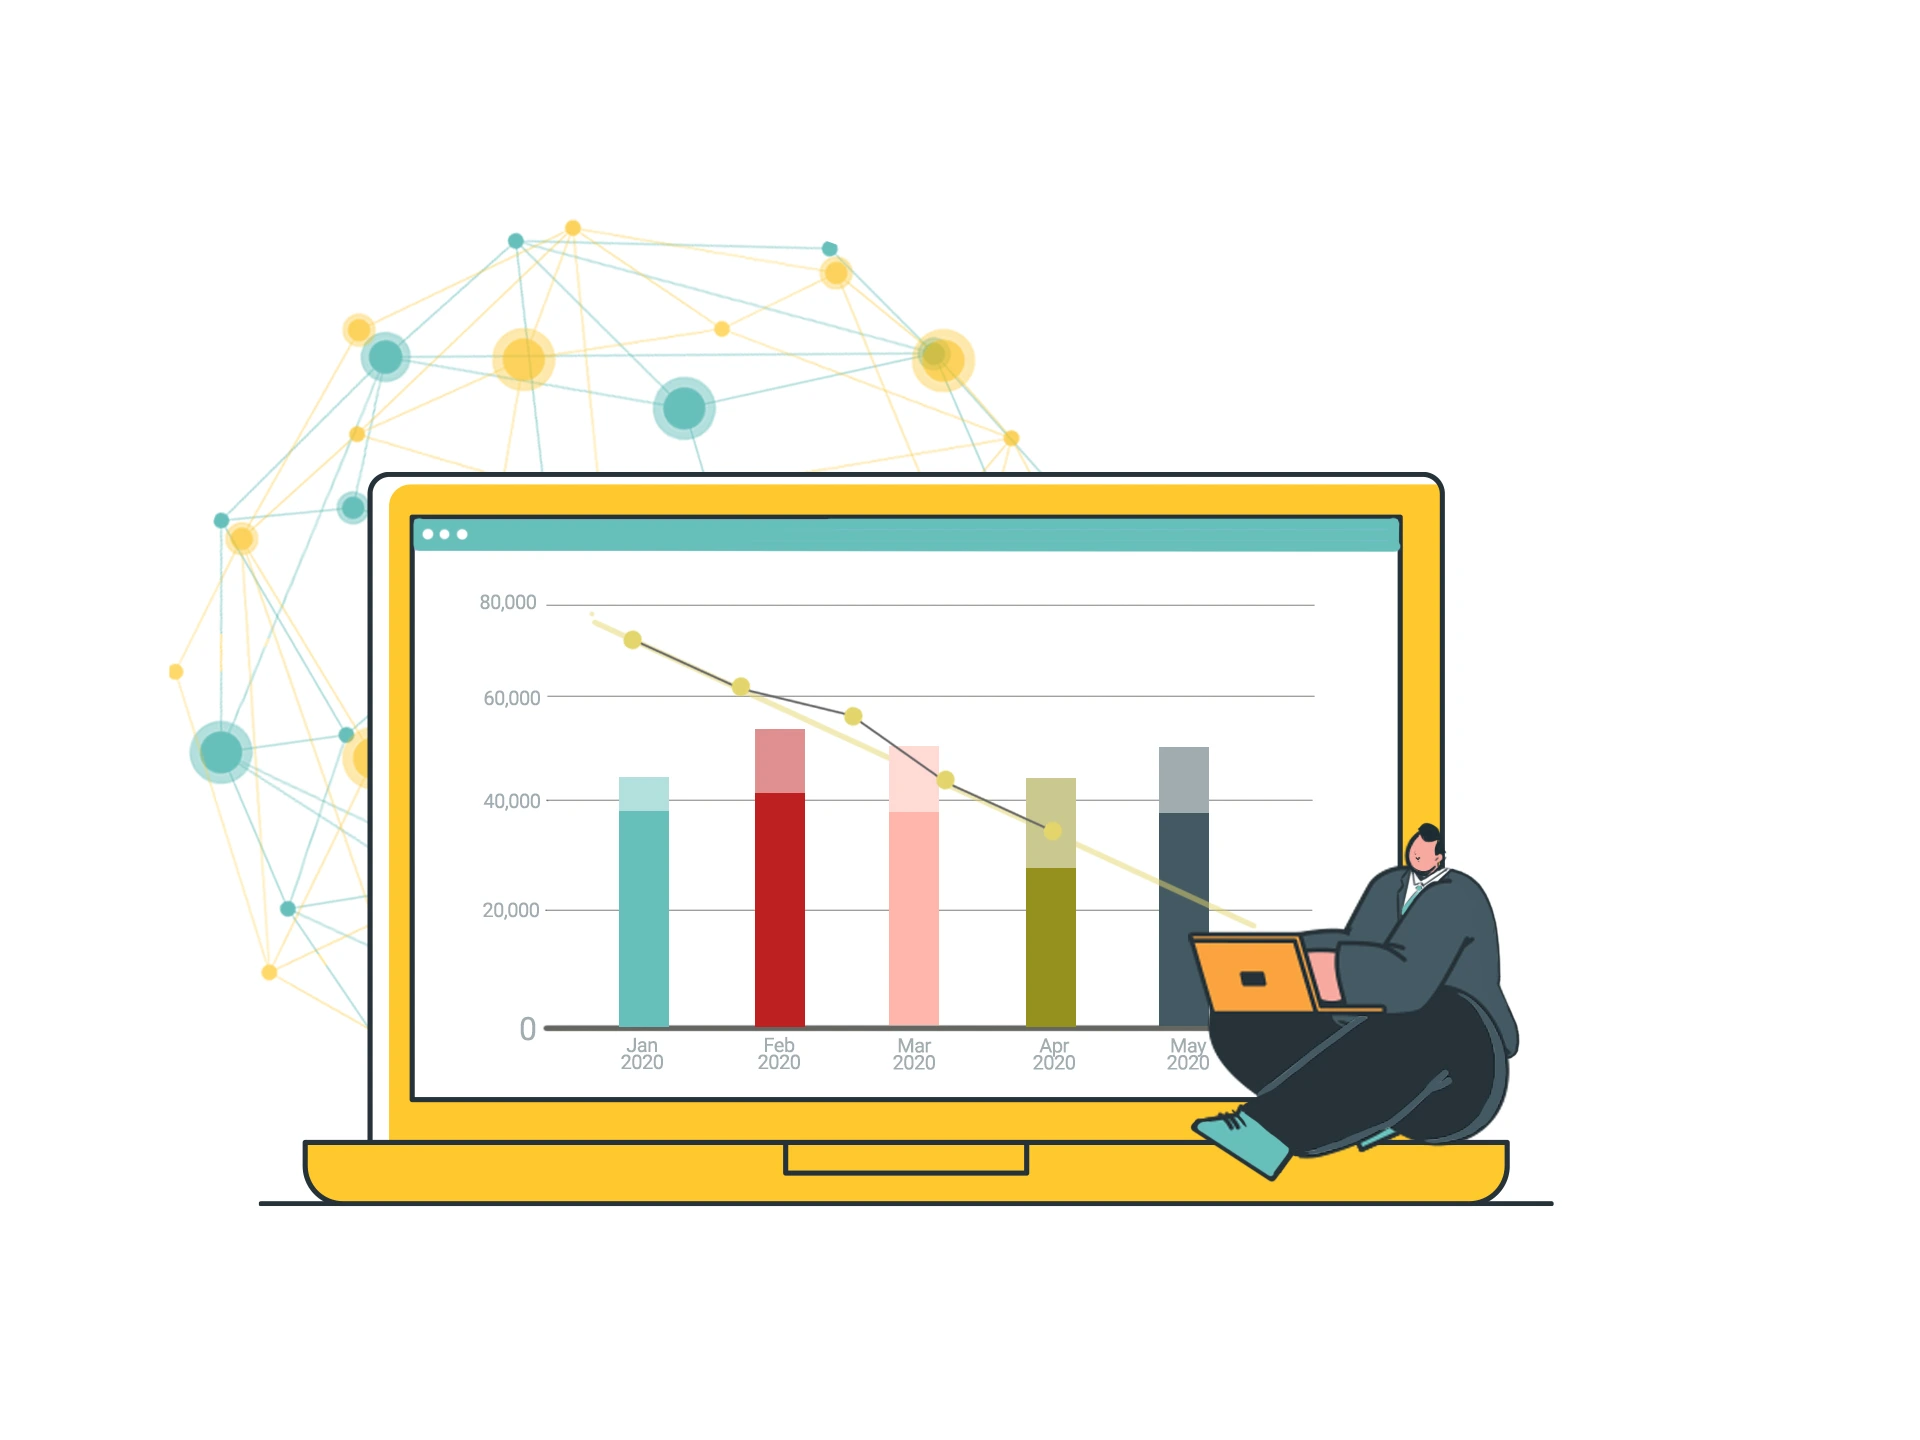
In today’s high-pressure project management landscape, staying on budget and meeting deadlines is critical. That’s where the burn rate chart becomes indispensable:
- 30% more tasks completed by teams using burn rate chart.1
- 25% increase in project timeline predictability with regular use. 2
- 20% improvement in efficiency by identifying and addressing bottlenecks.3
- 15% higher team satisfaction rate when the burn rate chart is regularly updated.4
Ready? Let’s explore how mastering a burn rate chart can transform your project outcomes.
What is a Burn Rate?
Burn rate is not just a metric; it’s the lifeblood of your project’s financial health. It measures how quickly you’re depleting your budget, indicating whether your project is on track or heading toward a financial pitfall.
Mismanage your burn rate, and you’re not just risking budget overruns—you’re jeopardizing the entire project’s success. It’s the single most telling measure of whether your strategy is financially sustainable.
Types of Burn Rate:
- Cash Burn Rate: This is your red alert for cash flow. It tracks the actual cash leaving your coffers within a specific period, which is crucial for startups operating on tight margins and short runways.
- Project Burn Rate: This metric tracks how fast you consume the budget allocated for a specific project. If your project burn rate spikes unexpectedly, it’s a red flag that demands immediate action—reassess your resources, scope, or timelines, or face costly overruns.
Why Burn Rate Matters in Project Management
Impact on Budgeting and Forecasting
Burn rate isn’t just a number; it’s the heartbeat of your project’s financial life. Misalign it, and you’re setting your project up for financial disaster—potentially burning through your budget before the project hits critical milestones.
With an accurate burn rate, you gain the foresight to adjust forecasts, reallocate resources, and prevent funding crises that could cripple your project.
Relation to Project Timeline and Milestones
Your burn rate directly indicates whether your project timeline is sustainable. If costs escalate faster than progress, it’s a red flag that milestones will be missed, timelines will slip, and the project’s scope may need drastic cuts.
The ruthless reality is this: if you’re not controlling your burn rate, you’re not controlling your project. Every dollar spent must be justified by tangible progress, or you risk the entire project going off the rails.
Read More: Milestone Trend Analysis ✅ 40% Faster Delay Identification
Key Benefits of Using a Burn Rate Chart

Enhanced Financial Visibility
- Acts as your financial command center, offering detailed transparency over spending.
- Ensures budget alignment with strategic goals, preventing costly overruns.
- Maintains absolute control over financial details, avoiding budget mismanagement.
Early Risk Identification
- Serves as a proactive risk management tool, tracking deviations in burn rate.
- Identifies and neutralizes financial threats before they escalate into major issues.
- Essential for preventing budgetary disasters and ensuring project success.
Core Components of a Burn Rate Chart
1. Key Metrics to Track
Budget vs. Actual Spend
This is your primary indicator of project health. Tracking the gap between budgeted and actual spending gives you real-time insights into whether your project is on course or hemorrhaging funds. Any deviation here demands immediate corrective action.
Cumulative Costs
Understanding cumulative costs is non-negotiable. It shows how your expenses accumulate over time, providing a long-term view of financial performance. This metric is crucial for identifying patterns of overspending before they spiral out of control.
Forecasted Burn Rate
Forecasted burn rate is your predictive tool for future financial performance. It lets you anticipate future spending based on current trends, enabling proactive adjustments. If this metric signals trouble, you must adjust your resource allocation or project scope immediately to avoid disastrous outcomes.
Read More: Power of Forecasting Methodology In Project Management ✅ +38% Success
2. Essential Data Sources
Financial Reports
These are your foundation. Accurate financial reports are indispensable for tracking every dollar spent. They provide the raw data to assess your burn rate and make informed decisions. Without precise financial reporting, your burn rate chart is built on sand, and any analysis will be flawed.
Project Management Tools
Project management tools are your command center for integrating data across teams. They centralize tracking of expenses, timelines, and resource allocation, ensuring that all data feeds into your burn rate calculations seamlessly. A lack of integration here leads to data silos and incomplete analysis.
Time Tracking Data
Time is money, literally. Time-tracking data correlates labor costs with project progress, offering a granular view of where resources are being consumed. Without this data, you’re blind to the true cost of labor and risk massive budget overruns due to inefficiencies.
How to Create a Burn Rate Chart
Step 1: Selecting the Right Tools
Spreadsheet vs. Specialized Software

Spreadsheet tools like Google Sheet 5 and Microsoft Excel 6 is versatile and widely used, making it a go-to for many project managers. It allows for customized burn rate tracking with formulas and pivot tables. However, its manual nature can lead to errors and inefficiencies, especially in complex projects.
Specialized software, on the other hand, automates data collection and analysis, offering real-time insights with far less manual input. Relying only on Excel can be a costly mistake for high-stakes projects; specialized tools provide the precision and automation needed to keep your burn rate on target.
Integrating with Existing Project Management Tools
Integration is non-negotiable. Your burn rate tracking tool must seamlessly integrate with your existing project management ecosystem, whether Microsoft Project 7 or another platform.
This ensures that data flows effortlessly between systems, reducing the risk of inconsistencies and ensuring that your burn rate chart reflects the most up-to-date information.
Without proper integration, you risk working with outdated data, leading to misguided decisions and potential project derailment.
Step 2: Data Collection and Preparation
Historical Data Analysis
Historical data is your first line of defense against budget overruns. It’s not just about collecting data but dissecting every dollar spent in past projects to identify patterns, inefficiencies, and cost drivers.
If your historical data is incomplete or inaccurate, your burn rate chart will be nothing more than a shot in the dark. You must demand rigor in this analysis, ensuring every figure is verified and every anomaly is scrutinized to build a reliable financial baseline.
Estimating Future Costs
Estimating future costs is where strategic foresight becomes non-negotiable. This step requires you to anticipate every possible financial contingency—scope changes, market fluctuations, resource availability—and translate them into precise cost projections.
A superficial estimate here will lead to disastrous consequences, either by masking financial risks or constraining your project unnecessarily. Approach this step with the precision of a surgeon, using scenario planning and sensitivity analysis to ensure your burn rate chart is grounded in reality and ready to guide decisive action.
Step 3: Building the Chart
Setting Up the Chart Structure
Your chart structure is the foundation of accurate burn rate tracking. Begin by clearly defining your time intervals and aligning them with key project milestones. Any ambiguity here will lead to confusion and misinterpretation down the line. Ensure the structure is robust, with clear labels and logical segmentation that reflects the unique demands of your project.
Inputting Data and Calculating Burn Rate
Precision is paramount when inputting data. Ensure every cost and expense is accurately captured, leaving no room for error. Calculate your burn rate with exactitude, cross-referencing against historical data to validate accuracy. Any discrepancies must be immediately addressed; there’s no tolerance for error in high-stakes projects.
Visualizing Trends and Projections
Visualization isn’t just about making data look good—it’s about making data actionable. Use your burn rate chart to identify trends at a glance, enabling you to anticipate issues before they escalate. Employ clear, intuitive visual elements that allow stakeholders to grasp the financial trajectory of the project instantly. Your goal is to transform raw data into a visual narrative that drives informed decision-making and proactive adjustments.
How to Interpret the Burn Rate Chart
Identifying Trends and Patterns
Overruns and Underspends
Overruns and underspends are critical indicators of your project’s financial trajectory. Spotting an overrun early allows you to course-correct before it spirals into a budget crisis.
Conversely, consistent underspending may suggest resource underutilization or project delays, both of which can derail your timeline. A ruthless project manager uses these signals to make immediate adjustments, ensuring the project remains on track and within budget.
Burn Rate Variability
Burn rate variability is the pulse of your project’s financial health. Significant fluctuations can signal instability or poor planning, demanding swift analysis to pinpoint the cause.
Understanding the root of this variability is essential for regaining control, whether it’s unexpected costs, scope creep, or inefficiencies. Consistent monitoring and interpretation of these variations allow you to mitigate risks and maintain a steady course toward project completion.
Common Pitfalls and Misinterpretations

Ignoring External Factors
Overlooking external factors—like market shifts, regulatory changes, or supply chain disruptions—can lead to catastrophic miscalculations in your burn rate analysis.
A project manager who ignores these elements risks creating a burn rate chart that’s out of touch with reality, leading to flawed strategies and potential project failure. Vigilance is key: always factor in external variables when interpreting your burn rate data.
Misjudging Burn Rate Fluctuations
Burn rate fluctuations are often misunderstood. A sudden spike doesn’t always spell disaster, nor does a drop guarantee efficiency. Misjudging these fluctuations can cause overreactions or complacency, both of which are dangerous.
A seasoned project manager digs deeper, analyzing the root causes behind these changes to ensure that the project remains on a stable financial path.
Actionable Insights
Adjust the Project Plan
A burn rate chart isn’t just a report—it’s a decision-making tool. You must act immediately when your burn rate indicates deviations from the plan.
Whether it’s reallocating resources, trimming unnecessary costs, or even revising project scope, the key is swift and decisive action. Delaying adjustments can turn small issues into major financial setbacks, jeopardizing the entire project.
Communicate Findings with Stakeholders
Transparency with stakeholders is non-negotiable. Your burn rate chart is a powerful communication tool that should be used to keep everyone informed about the project’s financial health.
Clearly present the data, explain any necessary adjustments, and outline the implications for the project timeline and deliverables. Effective communication ensures alignment and helps secure the support needed to make critical adjustments without delay.
Advanced Techniques for Burn Rate Analysis
Technique #1. Scenario Planning and Forecasting
Best-Case, Worst-Case, and Most Likely Scenarios:
Scenario planning is non-negotiable. If you’re not preparing for every possible outcome, you’re setting your project up for failure. Develop detailed best-case, worst-case, and most-likely scenarios to ensure you can pivot quickly, whether you’re facing unexpected delays or unexpected opportunities. In high-stakes projects, flexibility is your greatest asset.
Sensitivity Analysis
Sensitivity analysis isn’t optional; it’s essential. Test your burn rate against various variables to pinpoint which factors will derail your project. This analysis is your armor against financial surprises, enabling you to identify and neutralize risks before they escalate into project killers.
Technique #2. Integrating Burn Rate with Earned Value Management (EVM)
Correlating Burn Rate with Schedule Performance
Burn rate alone gives you part of the picture. Integrate it with EVM to correlate cost and schedule performance. This correlation isn’t just useful—it’s critical. It reveals discrepancies that could mean the difference between a project delivered on time and a project that spirals out of control. Don’t rely on guesswork; let data guide your decisions.
Using EVM for Predictive Insights
EVM provides invaluable predictive insights. By combining burn rate with EVM metrics like CPI and SPI, you can forecast not just the future but also the likely success of your project. If you’re not leveraging these insights, you’re flying blind, making decisions based on hope rather than hard data.
Technique #3. Automating Burn Rate Tracking
Real-Time Monitoring
In today’s fast-paced environment, real-time monitoring isn’t a luxury; it’s a necessity. Automated tools provide instant data, allowing you to react in real time. Waiting for monthly reports is a recipe for disaster. Stay ahead of issues by knowing your burn rate every minute of every day.
Automated Alerts and Notifications
Automated alerts are your early warning system; they’re not just helpful but essential. Set them up to flag any deviation in burn rate metrics immediately. This proactive approach means you’re never caught off guard, ensuring you can correct course before a minor issue becomes a major crisis.
Case Studies: Real-World Applications of Burn Rate Chart
Tech Startup Case Study
A tech startup8, backed by $2 million in Series A funding, was rapidly burning through its budget due to an underperforming marketing strategy. The leadership team, by closely monitoring their burn rate, identified that a significant portion of the budget was being allocated to ineffective marketing efforts.
Faced with the need to extend their runway, the team decided to reallocate a portion of the marketing budget towards R&D, focusing on product development. This strategic move helped the company refine its product, which in turn improved its market readiness and contributed to securing additional funding.
By maintaining a clear view of its burn rate, the startup could pivot effectively and avoid running out of resources before achieving a marketable product.
Infrastructure Project Case Study
In a large-scale infrastructure project valued at $100 million9, unexpected geological issues emerged early in the project, threatening to exceed the budget by a significant margin.
The project management team utilized burn rate chart alongside Earned Value Management (EVM) to monitor the financial impact of these issues in real-time. This approach enabled the team to identify potential cost overruns and take proactive measures, such as reallocating funds from contingency reserves and renegotiating contracts to control costs.
By integrating burn rate analysis with EVM, the team successfully minimized budget overruns and kept the project on schedule, preserving their financial resources and reputation for timely delivery.
Conclusion
A burn rate chart is a crucial tool for monitoring how quickly a project consumes its budget over time. It provides real-time insights into financial performance, helping project managers identify trends, anticipate risks, and make informed adjustments. Properly utilizing a burn rate chart ensures that your project stays on track, on budget, and aligned with its goals.
With Mirorim, you can integrate advanced burn rate management techniques into your projects seamlessly. Create a free account on Mirorim today and take the first step toward mastering your project’s financial health.
FAQ | Burn Rate Chart in Project Management
A burn rate chart visually tracks the rate at which a project consumes its budget over time, helping managers monitor financial health and project progress.
To create a burn rate chart, gather financial data (expenses vs. budget) over time, plot it on a timeline, and use a line graph to display the rate of spending.
A good burn rate depends on the project’s timeline and budget. Generally, it should align closely with your planned expenditures to avoid overruns.
Control your burn rate by regularly monitoring expenses, adjusting resource allocation, reducing unnecessary costs, and staying aligned with your project plan.
Yes, burn rate is a Key Performance Indicator (KPI) used to measure the rate of budget consumption, crucial for assessing project financial health.
A low burn rate indicates that a project is spending less than planned, which could suggest efficiency and signal underutilization of resources.
If a project has a $1 million budget and spends $100,000 per month, the burn rate is $100,000/month.
Net burn rate is calculated by subtracting the monthly cash inflows from the monthly cash outflows. It shows how quickly cash reserves are depleting.
Yes, burn rate is a financial metric that measures how fast a project or company is spending its available budget over time.
Burn rate is affected by factors such as project scope, resource allocation, operational inefficiencies, unexpected expenses, and changes in project requirements.
Calculate burn rate by dividing the total amount spent by the time period over which it was spent. For example, $200,000 spent over 2 months equals a $100,000/month burn rate.
Burn rate is important because it helps project managers track financial health, forecast funding needs, and make strategic adjustments to avoid budget overruns.
Decrease burn rate by cutting unnecessary costs, optimizing resource allocation, increasing efficiency, and revising the project scope to align with budget constraints.
References
- RELATIVE BURN RATES FROM FASTEST TO SLOWEST (rev. FEB ’24). (n.d.). https://hodgdonpowderco.com/wp-content/uploads/2024/02/2024-Smokeless-Relative-Burn-Rate-Chart-WEBSITE.pdf ↩︎
- Relative Burn Rates of Powders. (n.d.). https://hodgdonpowderco.com/wp-content/uploads/2023/04/updatedburnrateschart-1.pdf ↩︎
- Comparative Burn-Rate Chart Lists 163 Powders « Daily Bulletin. (n.d.). https://bulletin.accurateshooter.com/2020/04/comparative-burn-rate-chart-lists-163-powders/ ↩︎
- Powder Burn Rate Comparison Table — Download HERE « Daily Bulletin. (n.d.). https://bulletin.accurateshooter.com/2020/06/powder-burn-rate-comparison-table-download-here/ ↩︎
- What you can do with project plans in Sheets – Google Workspace Learning Center. (n.d.). https://support.google.com/a/users/answer/9310193?hl=en ↩︎
- Taylor, D. (2024, May 17). How to Use Excel for Project Management. The Motley Fool. https://www.fool.com/the-ascent/small-business/project-management/excel-project-management/ ↩︎
- Create a burndown report in Project desktop – Microsoft Support. (n.d.). https://support.microsoft.com/en-us/office/create-a-burndown-report-in-project-desktop-1022f20c-7931-4b14-81f8-880a0c532c41 ↩︎
- Mastio, C. (2023, August 8). Understanding Startup Runway: How to Manage Your Burn Rate. Founder’s CPA. https://founderscpa.com/understanding-startup-runway-how-to-manage-your-burn-rate/ ↩︎
- Bank, S. V. B. a. D. O. F. C. (2020, June 5). Understanding what your startup’s burn rate really means. Silicon Valley Bank. https://www.svb.com/business-growth/cash-flow-management/startup-burn-rate-cash-flow/ ↩︎